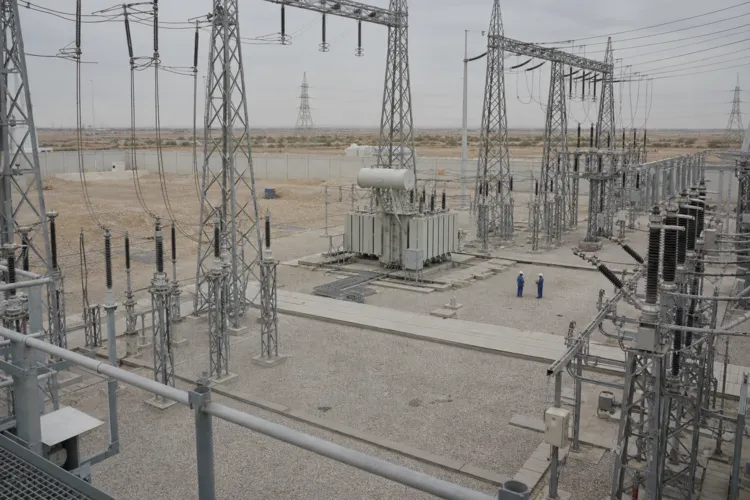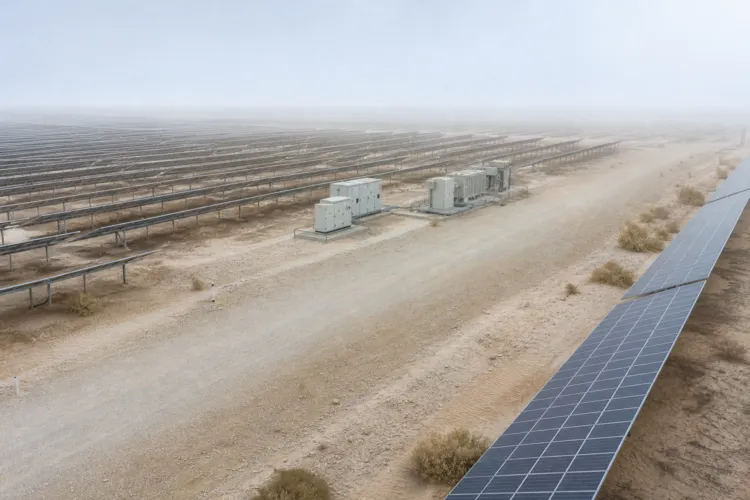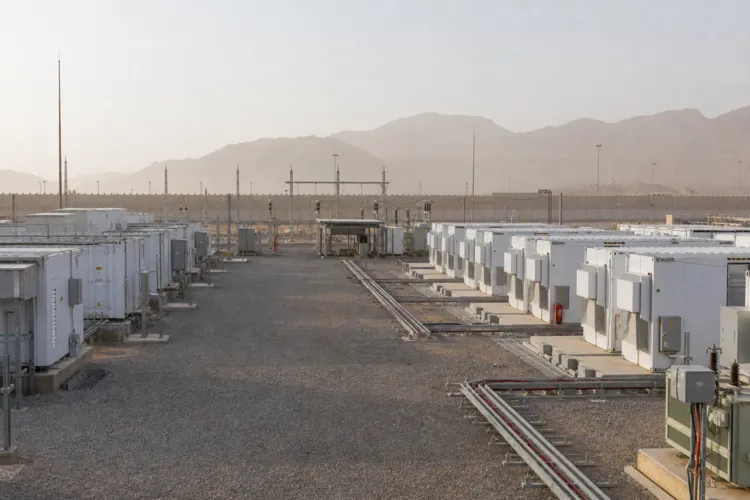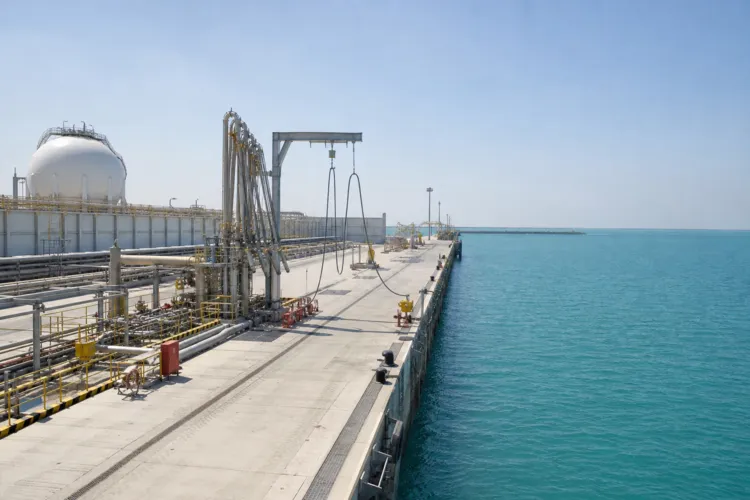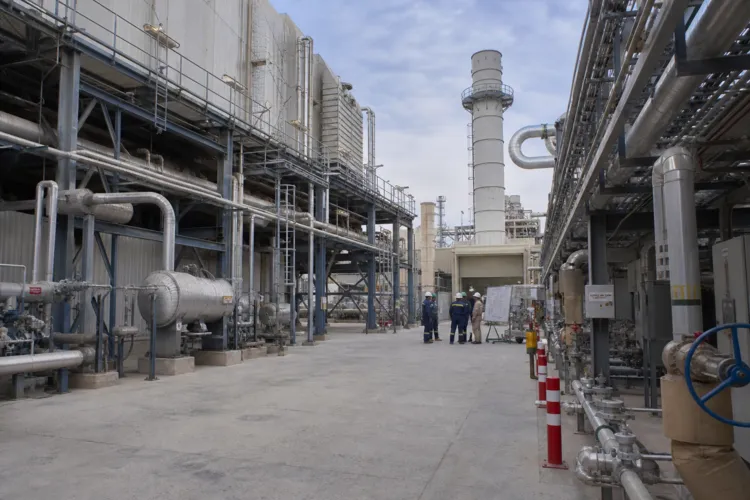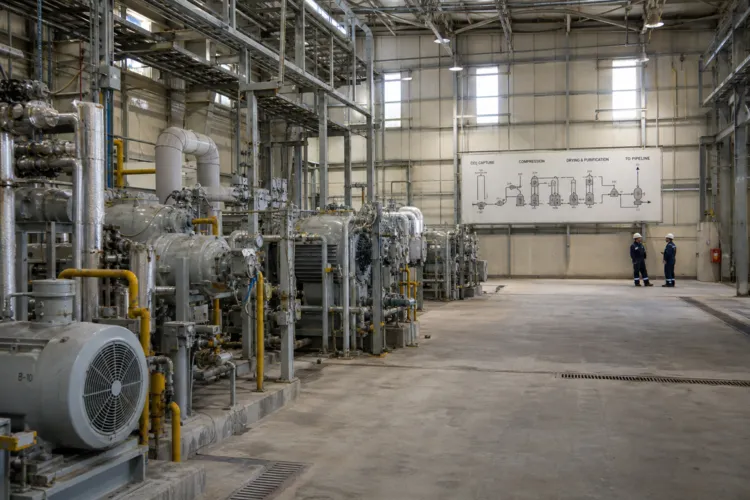
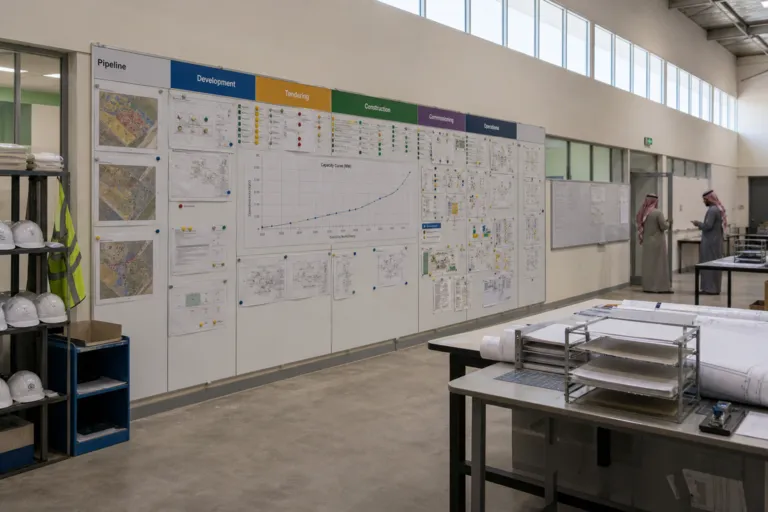
Saudi Arabia’s renewables pipeline is large on paper and uneven in delivery on the ground. As tracked by KAPSARC’s Saudi Arabia Renewables Tracker in September 2026, the country has 63.8 GW in a pipeline spread across 53 projects. Yet cumulative operating renewable capacity is reported at 19.3 GW in 2026, after increasing more than 63-fold since 2020. That split matters because it means a significant share of planned capacity is still waiting on execution, and roughly two-thirds of the pipeline remains unbuilt as of September 2026. This is the central tension shaping how investors and contractors interpret the Saudi renewable energy pipeline 2026 story.
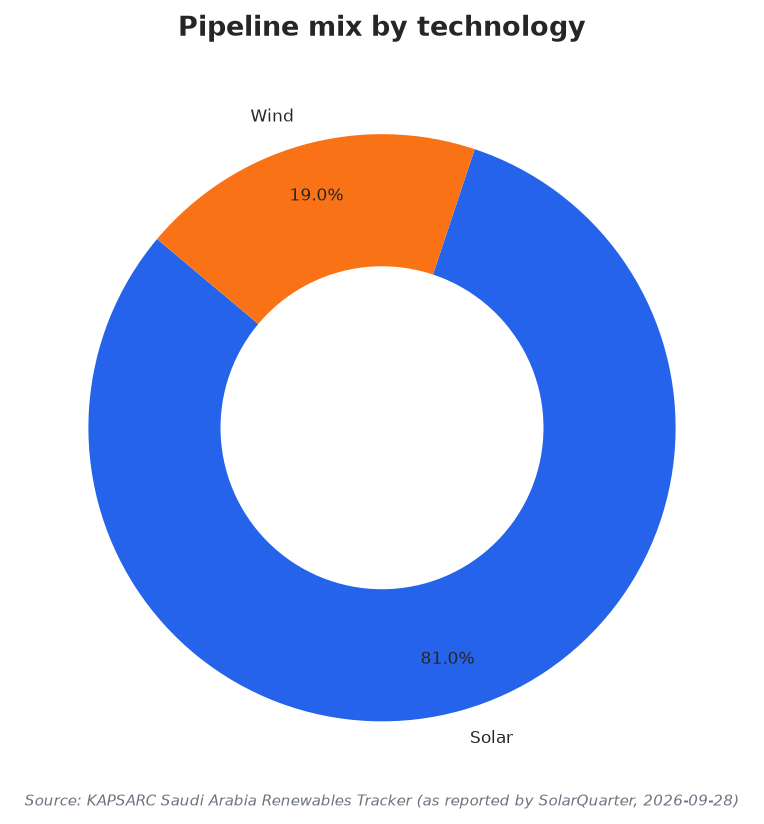
Where is the new capacity coming from? First, it is coming overwhelmingly from solar. Across the tracked portfolio, solar accounts for 81% of total capacity, while wind makes up the remaining 19%. Second, it is coming from projects that are not yet fully online. Around 30% of tracked capacity is operational, while 37% sits in under-construction or development status. Another 32% is in the tendering stage. In other words, the pipeline is not just a list of future plants; it is a staged queue, and the biggest near-term determinant of delivered GW is how quickly projects move from tender to build to commissioning.
The 2026 Commissioning Wave and the Regions to Watch
Several large projects anchor the 2026 additions and show how capacity is geographically distributed. The tracker lists eight projects with an expected commissioning year of 2026 totaling 7.7 GW, and six of those are recorded as installed. Named examples include 2 GW Haden solar in Makkah, 2 GW Muwayh solar in Makkah, and 1.5 GW Khushaybi solar in Al-Qassim. Smaller projects highlighted include 400 MW Tabarjal solar in Al-Jouf. Wind is also expanding, with a 600 MW Alghat wind project in Riyadh and a 500 MW Waad Al Shammal wind project in the Northern Borders. Two additional solar projects are still under development in 2026: 400 MW Henakiyah 2 in Madinah and 300 MW Rabigh 2 in Makkah.
Costs are another source of momentum, because multiple tracked projects are reporting very low levelized costs. Across the portfolio, LCOE ranges from 1.04 cents per kWh at Shuaibah 1 to 2.98 cents per kWh at Layla. Several solar projects under development have recorded average costs between 1.09 cents and 1.36 cents per kWh. One analysis also frames Shuaibah 1’s 1.04 cents per kWh as about 73% below BloombergNEF’s global utility-scale solar benchmark of $39 per MWh in 2025, emphasizing how price-competitive the Saudi build-out can look in global comparisons. These figures help explain why announcements, launches, and contractual closures can scale quickly once tenders clear.
Even with these signals, the pipeline’s path to 2030 is widely described as uncertain. Official targets call for 100–130 GW of renewable capacity by 2030 as part of Vision 2030, alongside a net-zero emissions target by 2060 and a stated goal of sourcing 50% of electricity from renewables by decade’s end. Independent forecasts cited in the same analysis place a realistic 2030 outcome at 45–95 GW, with a consensus clustering around 45–75 GW as curtailment and storage gaps constrain the upper end. The same research identifies 25–35 GWh of battery storage as a binding enabler for high solar penetration by 2030, describing it as an unmet requirement and a distinct investment opportunity within the wider build-out chain.
How large is Saudi Arabia’s tracked renewables pipeline in 2026?
Where is most new capacity in the 2026 Saudi renewable energy pipeline coming from: solar or wind?
What share of tracked capacity is operational versus still in the pipeline stages?
Which projects highlight the 2026 commissioning wave?
What do analysts say is needed to support higher solar penetration by 2030?
Talk to us for your needs in:
-
Energy Efficiency Strategy & Feasibility
-
Renewable Energy Strategy & Investment Advisory
-
Digital Energy & Smart Grid Strategy
-
Market Entry Strategy
-
Sustainability & Impact Strategy
-
Energy Project Governance & PMO Advisory
-
Energy Market Research
-
Energy Stakeholder & Customer Research
-
Energy Market Intelligence
-
Energy Feasibility & Investment Assessment
-
Energy Sector Benchmarking & Performance Strategy